Financial Insiders Issue Bearish Dow Jones Forecast for 2017
Retail investors are clearly buying the bullish Dow Jones forecast for 2017. The insatiable rally has reached epic proportions on the back of optimism regarding President Donald Trump’s proposed pro-growth policies. Despite this, some of the smartest investors in the world are sounding alarm bells.
The word “rally” may be slightly disingenuous. It’s probably best characterized as a “melt-up,” in which an absence of selling has a created a vacuum, favoring upward price momentum. Dow Jones futures seem to be constantly trading higher pre-market, leading to positive index openings and favorable trading tones. This is important, because the market historically closes higher over 70% of the time when it gaps higher.
Advertisement

A bearish Dow Jones forecast for 2017, after all, will not materialize without sustained and meaningful selling. Quite simply, new money entering the market will steadily and incrementally tend to push the market higher. There’s a reason why the old axiom, “Up like an escalator, down like an elevator” has stood the test of time. Although lately, the inverse seems to be true.
In a traditional market rally, sharp gains among a broad range of sectors on heavy volume would be expected. This might last a few days before profit-taking sets in, setting the market up for a temporary consolidation period. After the market had digested its newfound gains by reaching a short-term area of fair value, buying would again commence until the next equalization point was found. Traditional markets tend to rally in start-and-stop patterns, moving up 15%–30% of the time and consolidating the gains thereafter.
But that’s not really what’s happening here. This “rally” is producing the opposite effect. For lengthy periods, the market is “rallying” or melting up 70%–85% of the time, while consolidating for only short periods thereafter–the opposite of what’s typically seen.
This market serenity is further quantified by the Chicago Board Options Exchange’s (CBOE) Volatility Index (VIX). This is a widely followed index which shows the S&P 500’s market volatility expectations for the next 30 days. It also known as the “fear index” because low values tend to represent complacency in the marketplace.
Over the first seven months of 2017, the value trended steadily downward, and as of late July, was at a 10+-year low of 9.41. Essentially, there is almost no fear in the market, based on the premiums that investors are demanding in the options market.
While the VIX is a poor market timing tool, record-low levels generally foreshadow an eventual stock market crash. Regardless of whether the U.S. economy experiences newfound growth under Trump, for investors looking to make a long-term Dow Jones Industrial Average (DJIA) investment, the low VIX suggests it’s a case of “buyer beware.” It’s simply irrational to ignore the unusual price action dominating the DJIA.
Tempest in a Teacup or Something More?
Stock market predictions are notoriously tough to pin down, as irrationality can dominate the market much longer than anyone anticipates. One investor’s bane is another investor’s optimism, and there seems to be plenty of supply of the latter.
But slowly, peripheral cracks are starting to show around the edges. Many of them are bedrock presumptions centering around President Trump’s pro-growth agenda.
There are renewed concerns that Trump’s massive tax stimulus may not get implemented anytime soon. This is troubling to equity bulls, as tax cuts were arguably the biggest factor in the market’s unrelenting ramp-up.
Goldman Sachs Group Inc (NYSE:GS) believes that delays in repealing Obamacare could set back tax reforms in a procedural manner. Treasury Secretary Steve Mnuchin has said in televised interviews that “new policies will have at best a limited impact in 2017,” and that he “doesn’t expect to see growth until 2018.” (Source: “Trump’s ‘Aggressive’ Tax Timeline Is ‘Unachievable’: Beacon Advisors,” ZeroHedge, February 23, 2017)
Indeed, another pillar supporting the turbocharged DJIA forecast–construction, engineering and materials stocks–could come under pressure, as infrastructure spending may get delayed. A Height Securities, LLC analyst has noted that Trump is considering delaying his call to Congress to pass an infrastructure bill until the new year, given all the other priorities on Congress’s plate this year. (Source: “Infrastructure Stocks Tumble On Report Trump May Delay Infrastructure Bill Until 2018,” ZeroHedge, February 23, 2017)
As the stock market is a forward-discounting mechanism, delays to these Trump market rally assumptions should get reflected in equity prices. Or at least that’s what efficient-market theory tells us.
Keep in mind, major components of the DJIA are part of this group: Caterpillar Inc. (NYSE:CAT), General Electric Company (NYSE:GE), and United Technologies Corporation (NYSE:UTX). If these stocks get knocked down significantly due to infrastructure spending delays, it will be difficult for the DJIA to keep treading water.
30 Components of the Dow Jones Industrial Average (with P/E ratios)
| Company | Symbol | Current P/E Ratios | 5-Year Average P/E Ratio |
| Apple Inc. | AAPL | 17.51 | 13.67 |
| American Express Company | AXP | 17.51 | 15.03 |
| Boeing Co. | BA | 26.00 | 19.33 |
| Caterpillar Inc. | CAT | 19.68 | 19.72 |
| Cisco Systems, Inc. | CSCO | 16.09 | 14.73 |
| Chevron Corp. | CVX | 67.59 | 24.80 |
| The Coca-Cola Company | KO | 31.65 | 23.89 |
| E I du Pont de Nemours | DD | 30.99 | 19.68 |
| Exxon Mobile Corp. | XOM | 33.36 | 18.83 |
| General Electric | GE | 26.64 | 23.02 |
| Goldman Sachs Group | GS | 11.59 | 12.27 |
| Home Depot | HD | 21.93 | 22.48 |
| International Business Machines Corp. | IBM | 12.23 | 12.94 |
| Intel Corp. | INTC | 15.08 | 13.88 |
| Johnson & Johnson | JNJ | 22.84 | 19.94 |
| JPMorgan Chase & Co. | JPM | 13.43 | 11.53 |
| McDonald’s Corp. | MCD | 26.16 | 20.12 |
| 3M Company | MMM | 25.47 | 20.00 |
| Merck & Co. Inc. | MRK | 40.19 | 28.43 |
| Microsoft Corp. | MSFT | 27.15 | 22.39 |
| Nike Inc. | NKE | 23.86 | 43.38 |
| Pfizer Inc. | PFE | 28.08 | 20.55 |
| Procter & Gamble Co. | PG | 16.21 | 22.15 |
| Travelers Companies Inc. | TRV | 12.50 | 10.63 |
| UnitedHealth Group Inc. | UNH | 23.04 | 17.06 |
| United Technologies Corp. | UTX | 19.21 | 15.54 |
| Visa Inc. | V | 37.06 | 33.84 |
| Verizon Communications | VZ | 14.73 | 35.61 |
| Wal-Mart Stores Inc. | WMT | 17.26 | 15.29 |
| Walt Disney Co. | DIS | 18.65 | 19.77 |
Stock Market Predictions for the United States
Some Trump optimists may not have calculated certain “grey swans” into their economic assumptions. For example, how many analysts have plugged in Trump’s immigration restrictions into their equations?
A new study by the National Bureau of Economic Research estimates that for every one-million workers removed from the U.S. economy, a drag of 0.5% on gross domestic product (GDP) can be expected. President Trump’s crackdown on illegal immigration could have a deeply negative effect on sectors in which low-skilled workers play an important role in business continuity. One study suggests that removing all undocumented immigrants would cost the economy $5.0 trillion over 10 years. (Source: “Trump Deportation Threats to Constrict Already-Tight Job Market,” Bloomberg, February 22, 2017)
Of course, it will never get that far. But a 10% or 20% reduction of the workforce would have serious consequences for the U.S. economy.
Finally, to get a sense of the overvaluation pervasive in the market, we look no further than the cyclically adjusted price-to-earnings (CAPE) ratio. This ratio measures the index member stock prices (usually the S&P 500) divided by the 10-year earning average.
According to this metric, the CAPE ratio stood at 30.28 in late July, 2017, among the highest levels in recorded history. As the ratio’s long-term average is 16, this implies that the market was overvalued by 87.5%.
The CAPE ratio has only been higher on two previous occasions, in 1929 and 1999. Both were perceived to be raging bubbles at the time.
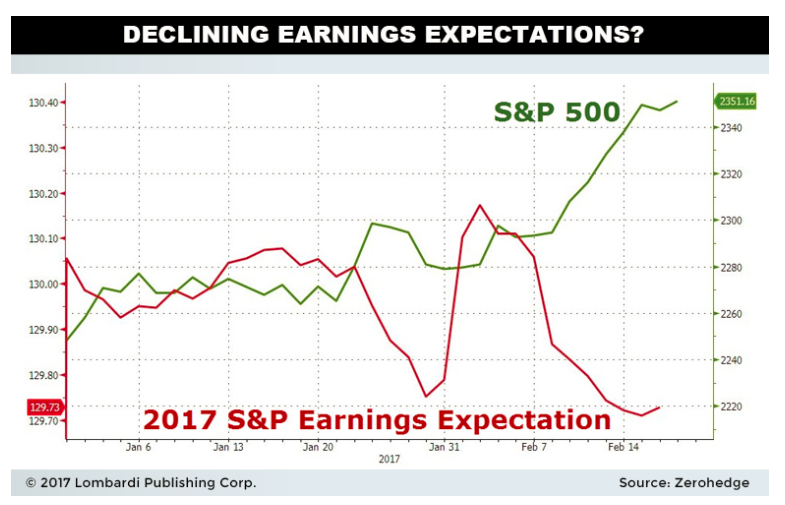
With the market trading so hot, investors would think that earnings expectations would be on the upswing, right? That would be incorrect.
As the below graph shows, earnings expectations in 2017 have been consistently falling, while the stock market has been rising unrelentingly. This can only mean that valuations are expanding from already-high levels. The increased “rubber band” stemming from stretched valuations can only lead to more chaotic selling when the market unwinds.
If corporate America cannot up its game, the resulting earnings letdown could be the spark that sets the crash in motion.
Dow Jones Forecast For 2017
The stock market outlook 2017 is quite bearish for some high-profile contrarians, so like-minded investors should take note.
Stealth increases in the bond market could reach critical mass, one of many potential “black swan” events going unnoticed. The huge rally in the 10-year Treasury note—from 1.32% to 2.375% over eight months—had been making consumer financing much more expensive for our credit-dependent society to pay its bills. This is why Marc Faber has warned that higher bond yields may cause the rally to sell. (Source: “Marc Faber Warns Higher Yields May Disrupt Rally Says To Sell,” Mark Faber Blog, February 21, 2017).
Faber is also not backing down from calling stocks to plunge by 40% or more. A drop of that size would take the Dow Jones Industrial Average down to 12,900 and erase all gains made since the start of 2013. Should the S&P 500 Index tumble 40%, it would hit 1,480 and take us back to levels not seen since early 2013. (Source: “It’s going to end ‘extremely badly,’ with stocks set to plummet 40% or more, warns Marc ‘Dr. Doom’ Faber,” CNBC, June 24, 2017.)
“Bond King” Bill Gross has also warned that reachable bond market yields could potentially cause a spike in rates. The bond market is perhaps the ultimate bubble, having been in a continuous rally for over three decades. When it breaks and interest rates soar, the stock market and corporate earnings are vulnerable to steep declines. “If 2.6 percent is broken on the upside…a secular bear bond market has begun,” said Gross. “Watch the 2.6 percent level. Much more important than Dow 20,000.” (Source: “Bill Gross: 2.6% 10-year yield is the key to everything this year,” CNBC, January 10, 2017).
Likewise, famed Quantum Fund co-founder Jim Rogers expects historically bad economic conditions in the near future. “Get prepared because we’re going to have the worst economic problems we’ve had in your lifetime or my lifetime and when that happens a lot of people are going to disappear,” he said. (Source: “Jim Rogers: “We’re About To Have the Worst Economic Problems Of A Lifetime, A Lot Of People Will Disappear,”ZeroHedge, February 12, 2017.)
Like Faber, Rogers is predicting a stock market crash, one that will rival anything he has seen in his lifetime. (Source: “JIM ROGERS: The worst crash in our lifetime is coming,” Business Insider, June 9, 2017.)
Where is the stock market headed? There’s still plenty of time for different scenarios to play out. But our stock market forecast for 2017 gets more contrarian with every passing week of irrational exuberance in the market.
Historically low volatility, extreme valuations, exceptional trade and geopolitical risks do not generally portend bullish outcomes. Perhaps at the tail-end of a bear market, when everyone is fearful, but eight years into the business cycle with the DJIA up 200% from the housing crisis bear-market lows? Not so much.
In the words of Jim Rogers, be worried.