Technical Analysis Suggests an Upside Ahead For Gold Prices
If you pay attention to the charts, they suggest that gold prices could soar significantly to the upside.
Gold is usually disregarded in the mainstream media because the yellow precious metal is dubbed boring. Mark my words, gold could be the next big trade in the making. Ignoring gold prices now could be a big mistake.
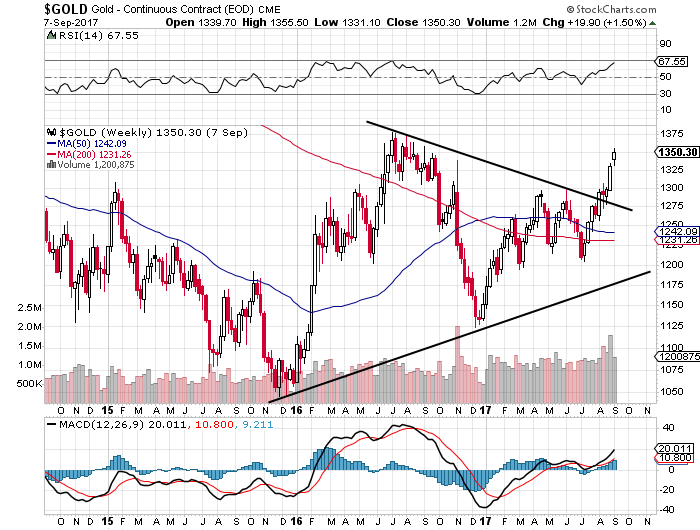
With this said, please look at the below chart of weekly gold prices and pay close attention to the lines and indicators drawn on it.
Chart courtesy of StockCharts.com
You see, since the lows made in 2015, gold prices have been forming a technical chart pattern called a “symmetrical triangle.” It’s drawn with black lines on the chart above. This pattern is developed when swings in prices become narrower and there’s consolidation. Also, you see an uptrend forming from the bottom and a downtrend forming from the top.
Also Read: The Gold Price Forecast 2018 Might Surprise You
Here’s the thing: this pattern could be bearish or bullish. The direction is only known once the price breaks away from the triangle. If it breaks above, you could say there’s a bullish breakout in the making and expect quick gains to the upside.
Know that, with every technical chart pattern, there are usually targets associated with them. With a symmetrical triangle, technical analysts usually take the widest part of the triangle and add it to the breakout point.
With this said, if we assume the widest part of the triangle to b between December 2015 and August of 2016, it is roughly $325.00-wide. Taking $1,275 as a breakout point, we could see gold prices soar to around $1,600. This is roughly 18% above where gold currently stands.
Two More Reasons To Remain Bullish On Gold
But, this isn’t all. Looking at the chart above, there are two more things that investors need to pay attention to.
First, look at the 50-week moving average and the 200-week moving average. Both averages are below gold prices. At their core, the averages suggest that the long-term and short-term trends are pointing upward and that bullish sentiment prevails.
Second, pay attention to the volume and the momentum indicators—the moving average convergence/divergence (MACD) at the bottom of the chart, and the relative strength index (RSI) at the top of the chart.
We currently see the momentum indicators trending upward, and volume is increasing. This tells us that, as prices move higher, investors are excited to buy. Buyers are in control of the price, and they could be taking the price much higher.
What’s Next For Gold Prices?
Dear reader, understand that gold prices are on track to increase for a second consecutive year. So far this year, the yellow precious metal has seen its price rise by about 16%. Don’t for a second disregard this increase.
You must think from an overall perspective. Those who ditched gold in 2013 could be looking at the rise in the precious metal and thinking about coming back to it. I wouldn’t be shocked if early next year we see massive inflows to the gold market. Obviously, with time, we will know more.
In the meantime, as charts paint a bullish outlook for gold, I am paying close attention to mining company shares. As gold prices increase, mining companies could generate leveraged returns for investors.


