High Stock Margin Debt Always a Harbinger for Market Tops
It’s happening again. NYSE stock margin debt is once again at record levels. This always correlates almost exactly with market tops. The margin is hanging in now, but we’re not so sure going forward.
Not only is the aggregate amount of stock margin debt at record highs, but so is the margin debt as a percentage of GDP. The former is pushing $550.0 billion while the latter now stands at 2.86%. That’s easily an all-time record, eclipsing the 2.63% mark in mid-2007 and 2.78% in the year 2000. (Source: “Stock Margin Debt Signal Reaches 5 Alarm Level,” Seeking Alpha, August 30, 2017.)
The correlation between stock margin debt and price is very tight. If the peak (or near peak) is set, stock prices will fall. There’s no question about it. Stock margin debt is the jet fuel that makes the market move; both up and down. For the market to keep advancing, the margin needs to keep expanding.
But at 2.86%, how high can it go? It’s already past thresholds that have marked previous market tops. Perhaps it’ll be different this time, but I doubt it. The likely answer is that just like the valuation expansion underpinning stocks, margin debt is experiencing the same phenomenon. Investors and institutions are piling in, chasing the unbridled momentum that has persisted since 2011.
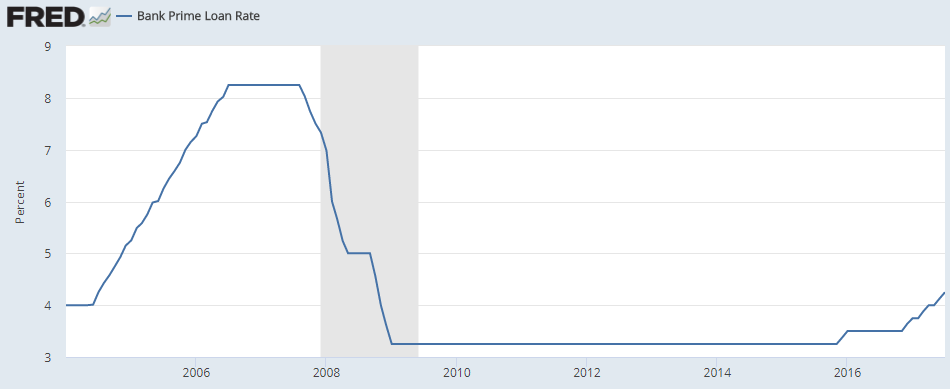
And it helps that banks are able to borrow money cheaply, at much lower levels than 30-year fixed-year mortgage rates or 10-year Treasuries. For several years, the cost of overnight intrabank lending was almost free. Borrowing is getting more expensive, but all this cheap credit is undoubtedly responsible for the “valuation bubble.”
Low interest rates equals cheap stock margin debt. A simple equation, and one that’s poised to reverse fairly soon.
Stock Margin Debt Magic Number
How high could stock margin debt as a percentage of GDP go? It’s hard to foretell, but I’d watch the three-percent level. There are so many factors driving margin growth that giving precise estimates is tricky.
One factor is the virtuous relationship between margin debt and equity prices. When the value of stocks keeps rising, banks and brokerages have more money to lend. Upward momentum in stocks drives investor demand, which equates to more margin debt demand. One demand feeds off the other.
Also Read: 3 Economic Charts Suggest Strong Possibility of Stock Market Crash in 2017
Another factor is interest rates. Obviously, when rates are more expensive, investor margin interest will be more expensive. That makes holding stocks on margin more expensive to maintain.
The typical retail investor might pay the prime rate plus “x” to use margin. Institutional holders will pay less. Rock bottom rates have fueled stock margin debt expansion. The way things are going, it may continue somewhat until either interest rates get more expensive, or the market does.
When the big sell-off arrives, it’s worth noting that margin debt can exacerbate the sell-off. That’s because a sharp sell-off can create margin calls (not enough equity to cover stock margin requirements), forcing investors to either add more equity or liquidate positions. Many investors aren’t in positions to add more free capital to their brokerage accounts and choose to sell stocks instead. This creates additional selling pressure in the market.
When things get dicey enough, it can engulf the market. The 1929 stock market crash was largely a result of margin selling on steroids, causing wave after wave of forced selling. The NYSE lost around 40% of its value between October-November 1929, with some of the worse individual losing days on record. Margin selling was a primary culprit.
Today’s market is different. It trades on algorithmic rules, there’s more passive investing, and there are more checks and balances with things like circuit breakers. Central banks were also more laissez faire back then. But in the end, stocks trade hands with the same supply/demand dynamics.Thus, high stock margin debt is a concern from both a market timing perspective and a forced selling one. The 1929 calamity may not strike, but today’s version could be uniquely nasty.
Back-to-Back: Black Monday and Black Tuesday Carnage
| Date | Change | % Change | Close |
|---|---|---|---|
| October 28, 1929 | −38.33 | −12.82 | 260.64 |
| October 29, 1929 | −30.57 | −11.73 | 230.07 |


