The Stock Market Could Be Forming a Top as These Charts Tell a Bearish Tale
There is one thing stock investors shouldn’t forget: stock market tops take a long time to form, and bottoms happen very quickly.
Before going into any details, know that predicting the exact tops and bottoms could be dangerous to portfolios. You only know about them once they have already formed. But there are some indications that suggest when a top or bottom could be nearing.
Why do tops on the stock market take a long time to form?
This could be because it takes a while for things to play out. The stock market is essentially a forward-looking animal and, at times, it could be difficult for the overall market to come to a consensus.
Once investors as a whole become bearish, we see a sell-off follow.
A Top in the Making Now?
Sadly, as it stands, it looks like we could be seeing a giant top forming on the stock market.
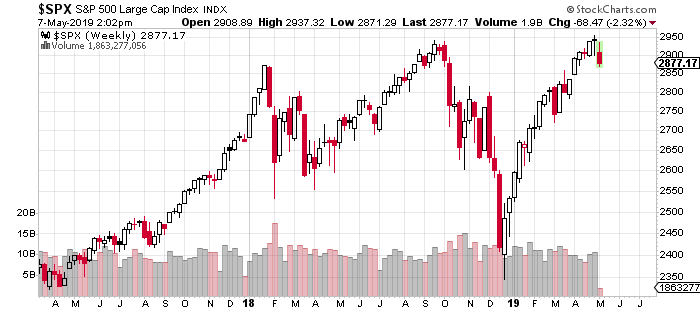
Please look at the chart below. It plots the S&P 500.

Chart courtesy of StockCharts.com
Notice something interesting?
Since the beginning of 2018, the S&P 500 has found resistance around 2,950. Whenever the index has reached that level, we’ve seen sellers come in. It refuses to break higher.
Look at Past Price Action
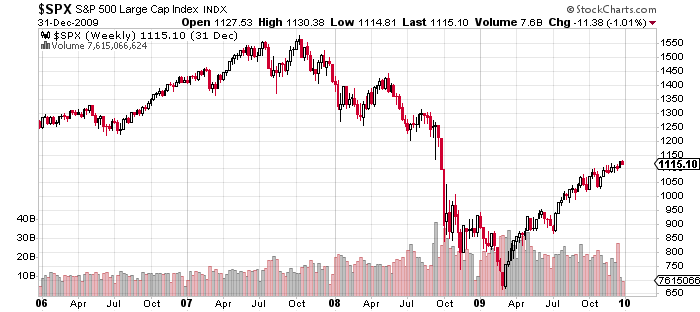
Now, with that out of the way, look at the chart below. It plots the S&P 500 from 2006 to 2010. Just see if you can spot a resemblance:

Chart courtesy of StockCharts.com
Look at what happened to the S&P 500 throughout 2007: the stock market kept finding resistance at around 1,550. We saw a lot of choppy trading; it kept swinging between 1,550 and 1,400 for a year. And then, eventually, sellers dominated and took the market lower.
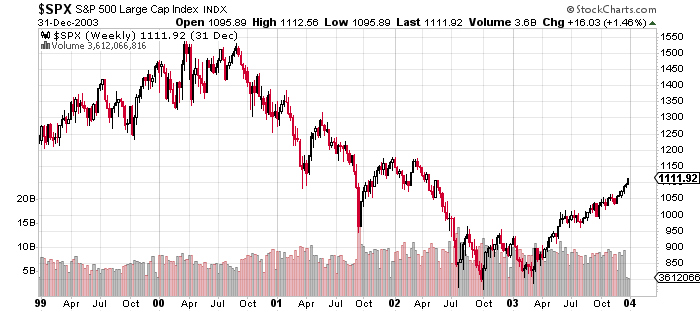
Look at the following chart as well, which plots the S&P 500 from 1999 to 2003:

Chart courtesy of StockCharts.com
Pay very close attention to what happened to the S&P 500 in 2000: just a lot of choppy trading and a lot of resistance around 1,500. The S&P 500 touched that level about three times and just refused to break above it.
So, looking at what’s happening on the S&P 500 over the past year, one has to wonder if a stock market top could be being made.
It’s possible, at the very least. Obviously, time will tell.
How Low Could the Stock Market Go? 27% Downside Possible?
If there’s a top being formed, then next could be an outright sell-off.
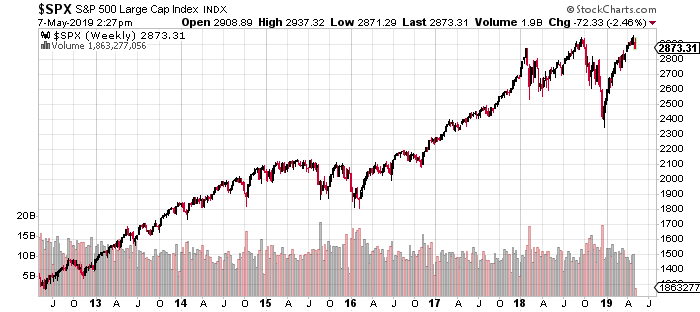
The next sell-off on the market could be a big one. Look at this last chart to see how low the stock market could go:

Chart courtesy of StockCharts.com
You see, whenever there’s a major sell-off, the stock market tends to top a major support level.
On the S&P 500, the next major support level isn’t until 2,100; it traded at that level in 2016. That is 27% below where it currently trades and would easily put the stock market in bear market territory.
Looking at all the charts above, I can’t help but preach capital preservation. I don’t have the power to predict exact tops (if anyone says they do, run away from them), but if previous price actions have taught us anything, then something bad is brewing on the stock market.


