Technical Analysis Paints Bearish Outlook for the U.S. Dollar
If you are looking for direction on the U.S. dollar, it’s important to pay attention to the charts. They suggest that the greenback stands at an inflection point, and that a U.S. dollar collapse could be possible.
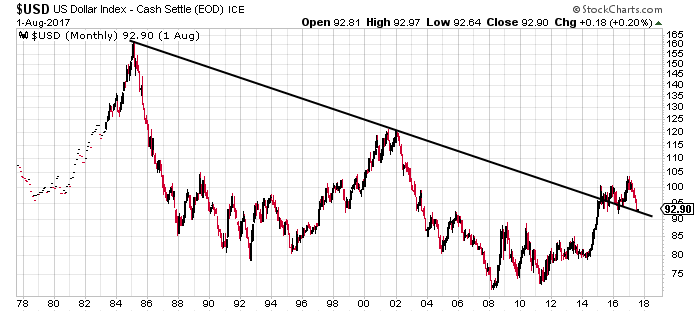
First, look at the very long-term chart below of the U.S. dollar index. Also, pay close attention to the trend line drawn on the chart. Remember, the dollar index tracks the performance of the U.S. dollar relative to other major global currencies.
You see, since the mid-1980s, the U.S. dollar was in a downtrend. In late 2014 and early 2015, it broke above this trend and remained above it for a while. One of the biggest reasons behind this rise was anticipation that the Federal Reserve would be raising interest rates.
In early 2017, things took a turn and the U.S. dollar has been declining since. It has declined six out of the first seven months of 2017—down roughly 10% year-to-date.
Chart courtesy of StockCharts.com
What’s interesting to note here is that the decline in 2017 has brought the dollar index to the downtrend that was in place since the mid-1980s. Where the U.S. dollar currently stands is at an inflection point. Know that if it breaks lower and the downtrend persists, the greenback could collapse to below 2008 lows.
Will the U.S. Dollar Break Lower?
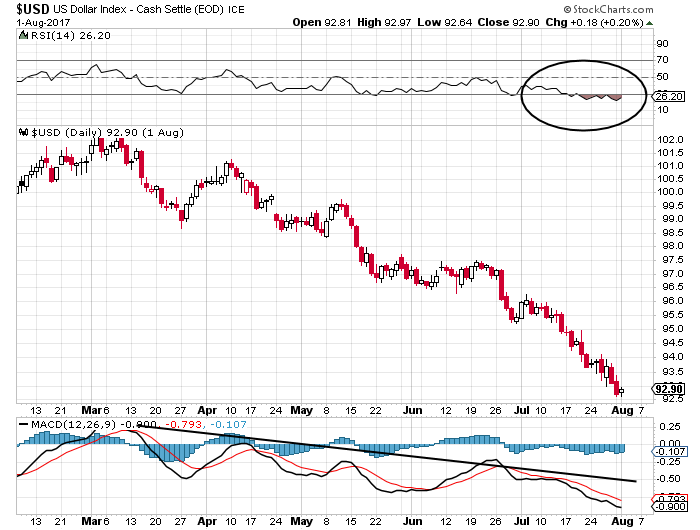
Now, look at the short-term chart. It suggests that the U.S. dollar could really could resume its long-term downtrend.
Chart courtesy of StockCharts.com
On the chart above, there are two main indicators that investors need to pay attention to: the moving average convergence/divergence (MACD) indicator plotted at the bottom of the chart, and the relative strength index (RSI) at the top of the chart.
At its core, the RSI tells us if a price is oversold or overbought. Currently, the RSI is in the oversold area and remains there (below 30). Don’t be mistaken here; oversold doesn’t mean an irrational selling and buying opportunity. It just means that sellers are growing in numbers.
MACD essentially tells us which way the momentum is moving. If it’s trending lower, it means sellers are in control and they could take the price lower. This is what we see on the U.S. dollar currently.
These two indicators are loud and clear; the greenback could continue to decline.
How Low Could the U.S. Dollar Collapse?
Dear reader, if the U.S. dollar continues to decline and it resumes the downtrend, it’s going to be very bad. As I said earlier, the U.S. dollar index could potentially go below $75.00, to the 2008 lows.
Mind you, the fundamentals are backing a decline in the U.S. dollar as well. Not too long ago, we heard from the Federal Reserve. It is concerned about inflation. This could mean that the Fed may not be raising interest rates as much as many anticipate. This could have adverse effects on the dollar.
Why? Because the Federal Reserve has convinced investors that rates could be heading to as high as three percent by 2019. So, they priced three percent in dollar valuations. Imagine if the Fed comes out and says “There will be no more rate hikes until mid-2018, and we don’t see the federal funds rate reaching 3.00% by 2019.”
We could actually see panic selling in the U.S. dollar on this news.
Investors beware.


