Decline in Gold Prices May Be a Blessing in Disguise
Over the past few months, the price of gold has lagged a bit. We’ve also heard a lot of noise about how the yellow precious metal may not be worth holding, and that it could go down a lot.
So, could gold prices actually drop?
Don’t get too boggled by the noise. The decline in the price of gold may be a blessing in disguise for investors.
Obviously, time will tell us more, but look at the following three charts. They say gold prices could be setting up to make a move to the upside, and that the downside risk may be very little.
Near Term: Double Bottom Forming on Gold Prices
On the daily chart, on the surface it seems like bearish sentiment is prevailing in the gold market.
Currently, gold trades below its 50-day and 200-day moving averages. This suggests that both the short-term and longer-term trends are pointing downward. The momentum indicators suggest that there may be more sellers than buyers in the gold market at the moment.
However, don’t ignore what has happened to gold prices between early March and now. We’ve seen the formation of a double-bottom pattern; this is when a price has touched a certain level twice and has bounced higher. In the case here, the gold price level around $1,675 has held strong.
The next level to watch could be $1,750. A sustained move above that level could be a very bullish signal.

Chart courtesy of Stockcharts.com
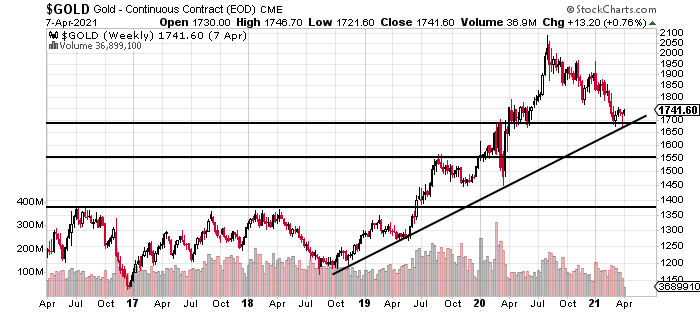
Medium Term: Upward Trend Persists
For the medium term, the gold chart looks bullish.
Remember the most basic rule of technical analysis: the trend is your friend. As it stands, a bullish trend is prevailing. It began in late 2018. Gold prices continue to make consecutive higher highs and higher lows.
As for the downside, there are three support levels that could be worth watching if this trend breaks: $1,675, $1,550, and $1,375.

Chart courtesy of Stockcharts.com
Long-Term: Massive Move Could Be Brewing
The following chart pattern shouldn’t be new to long-time readers of Lombardi Letter; it has been mentioned here before.
Over the past several years, gold prices have formed a technical-analysis chart pattern called a cup and handle. It’s drawn on the chart below. This pattern forms when prices trade in a U-shaped pattern followed by a slight downward drift at the end.
This is a bullish pattern, and once the price breaks away from the downward drifts, it moves higher.

Chart courtesy of Stockcharts.com
Gold prices remain in a downward drift for now, but once they break, we can expect to see rapid returns.
How far could the price of gold surge? Technical analysts set targets with this chart pattern by measuring the distance between the right peak and the bottom of the cup, and then adding it to the breakout point of the downward drift.
In this case, the distance from the peak and the bottom of the cup is about $1,000. Assuming a breakout point of $1,850, this chart pattern says gold prices could go as high as $2,850.
Where’s The Opportunity?
Dear reader, if you’re bullish on gold and not paying attention to gold miner stocks, you could be making a very big mistake. Miners provide leveraged returns.
Let me also say this: the recent sell-off in gold has created many solid opportunities in the mining sector. I see tons of quality miners selling at massive discounts.


