Big Banks Turning Bullish on Gold Prices
Gold prices seem cheap now. If you are not looking at the yellow precious metal, you could be making a big mistake.
Over the past few years, the fundamentals of the gold market have improved immensely. And now, the big banks that were bearish on the precious metal are changing their narrative.
Keep in mind that it was the big banks’ bearish sentiment that caused a massive sell-off in gold from 2013 to 2015.
Look at Goldman Sachs Group Inc (NYSE: GS), for example. It was leading the pack in 2013. It was Goldman Sachs that called gold a “slam dunk sell” back then. (Source: “Goldman Sachs: Gold is a ‘slam dunk sell’,” CNBC, October 14, 2013.)
Now the bank’s take on gold is the complete opposite.
Just recently, economists at Goldman Sachs said, “Combined with CB [central bank] gold purchases related to de-dollarization, we maintain our bullish gold target of $1,600/toz despite a potential easing in policy uncertainty.” (Source: “Gold prices to hit $1,600 in April and it’s not because of the Fed,” Kitco News, October 28, 2019.)
UBS Group AG (NYSE:UBS), another major bank, is relatively conservative when it comes to gold. Now it’s feeling optimistic about the precious metal.
In one of its recent reports, UBS said that gold prices could go as far as $1,730 an ounce by next year. Why? It said, “An environment of negative and lower-for-longer real rates, slowing growth with downside risks, and elevated uncertainty strengthens the case for holding strategic gold allocations.” (Source: “UBS Doubles Down On Gold — Ups Its Forecast Again!” Forbes, September 30, 2019.)
Is this surprising? Not at all.
What the banks are saying now, I have been saying for years.
However, you must understand that big banks have a lot of influence over institutional investors. If they are turning bullish, it’s possible that deep-pocketed investors will allocate some money to gold. And this could be great for gold prices.
Keep in mind that the gold market is small relative to the stock market or the bond market. It won’t require a lot of money to flow through for the price of gold to skyrocket.
Gold Prices Technical Analysis
Dear reader, beyond what the banks are saying, it’s important to pay close attention to the gold-price action. There are some interesting developments.
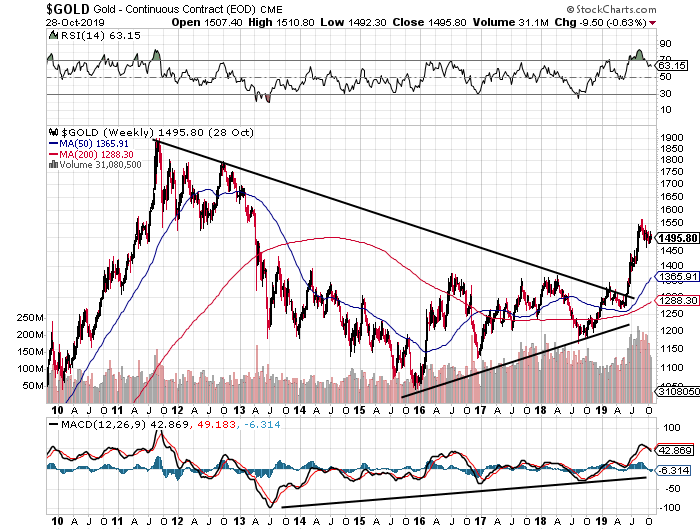
Please look at the chart below. It shouldn’t be new to long-term Lombardi Letter readers.

Chart courtesy of StockCharts.com
Since 2011, we have seen the formation of a chart pattern called a “symmetrical triangle.” In simple terms, a symmetrical triangle develops when there is a prevailing downtrend and an uptrend.
Mind you, this pattern is not bullish or bearish. You only know what will happen once the price breaks out of the triangle. So if the price breaks above the triangle, an upside move usually follows.
A few months ago, we saw gold prices move above the triangle around $1,300. And this is super bullish.
You see, in technical analysis, with every chart pattern, there are rules as to how far the price could go.
When it comes to a symmetrical triangle, you take the widest part of the triangle and add it to the breakout point (the point where the price broke out of the triangle).
In the chart above, the widest part of the triangle is the price action from late 2011 to late 2015, and it’s about $800.00 wide.
If we add $800.00 to the breakout point of $1,300, that means gold prices could surge as high as $2,100.
In conclusion: don’t ignore gold. The fundamentals are looking good, the charts look amazing, and even the banks’ sentiment is turning in favor of it.


