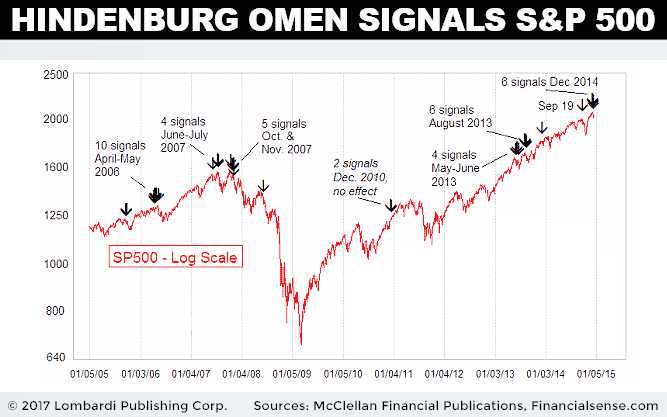
Hindenburg Omen Makes A Dramatic Comeback Amid Market Spasms
What is the “Hindenburg Omen?” This financial media indicator get a lot of press, yet is still generally misunderstood by the general public. It’s recently made a comeback, making market pros skittish, considering its timing amid deep market uncertainty. But if the indicator’s predictive power is any indication, the current stock market rally could be in trouble.
Named after the notorious German airship which crashed 80 years ago, the Hindenburg Omen is an indicator developed by late blind mathematician Jim Miekka. The theory behind it parallels Norman G. Fosback’s High Low Logic Index (HLLI), which tracks the New York Stock Exchange’s (NYSE) new highs or new lows, divided by the number of NYSE issues traded. The logic behind it is that new highs and new lows will happen in any market, but not together. Abnormal numbers may indicate the market is chaotic (lacking uniformity), and thus may signal trouble. Hindenburg Omen new high/new low thresholds vary; some consider 2.2% indicative, while some consider 2.8% indicative.
Also Read: Stock Market Crash 2017? This Could Trigger a Stock Market Collapse
For the technically inquisitive, overall Hindenburg Omen rules are as follows:
- The daily number of new highs and new lows on the NYSE–above 2.8%
- The NYSE Composite Index should be greater than the 50-day period. It could be equivalent to ,as the 50-day ROC of the NYSE index should be positive.
- Negative McClellan Oscillator (19,39)
- The number of new highs cannot be double that of new lows
As for predictive power, it’s about as good as it gets in the indicator world. Hindenburg Omen effects were felt in both the 1987 and 2008 market crashes, with an overall 25% success rate. That number may not appear especially high, but considering market tops can take years in the making and are notoriously hard to pin down, one in four isn’t bad. Just like the .250 slugger in baseball with 50 home runs, the pitcher still fears his presence in the batter box, even though its more likely he’ll strike out. With the S&P 500 alone worth $15.0 trillion, Wall Street pundits will take any edge they can get.
After a flurry of Hinderburg Omens in late spring 2017, the signalling is back. It’s all the more significant since “clustering” of omen signals are more predictive than one-offs.
The latest salvo occurred on August 16, when more 52-week lows actualized than 52-week highs. This hadn’t happened since July 2015. This extreme divergence had triggered the S&P 500 in five of the previous six sessions.
“It’s a serious signal that highlights times of decoupling within an index or exchange. The S&P hasn’t suffered five signals so tightly clustered since 2007., and 2000 prior to that,” said Jason Goepfert, President of Sundial Capital Research. (Source: “Bad News For The Stock Market: The Hindenburg Omen Is Back,” MarketWatch, August 19, 2017.)
Ominous Warning And How It Could Affect The Current Stock Market Rally
Hindenburg Omen clusters typically lead to poor performance. Whether correlation equals causation is unknown, but the bottom line is that this indicator spells trouble.
For example, the last time a comparable swarm of omens occurred in November 2007, the market fell 1.6% that week, 2.3% two weeks later, and 40% one year later. Talk about lagging performance.
What makes this one particularly ominous is that it’s occurring in all four indexes (Dow Jones Industrial Average, S&P 500, NASDAQ, Russell 2000). So the signal is broad bases and not confined to sector. On the NASDAQ, less than half its components recently traded above their 50- and 200-day moving averages, despite the index being at all-time highs. That would be quite usual for a exchange trading so robustly. (Source: Ibid.)
When Hindenburg Omen signals occur, it doesn’t mean investors should sell portfolios indiscriminately. It also doesn’t mean stock market crash predictions 2017 will automatically transpire.. It simply means there’s a semi-imminent threat that the market is experiencing bipolar activity. And since chaotic movements are not the basis of solid fundamentals, that usually means trouble.
This is doubly true in today’s world or snakes and ladders. There’s literally so many potential negative catalysts on the horizon, it’s hard to keep up. The U.S. debt ceiling crisis, North Korea, the Fed balance sheet tightening…
Perhaps the Hindenburg Omen is ahead of the curve.


