Stocks Susceptible to Crash in Coming Months
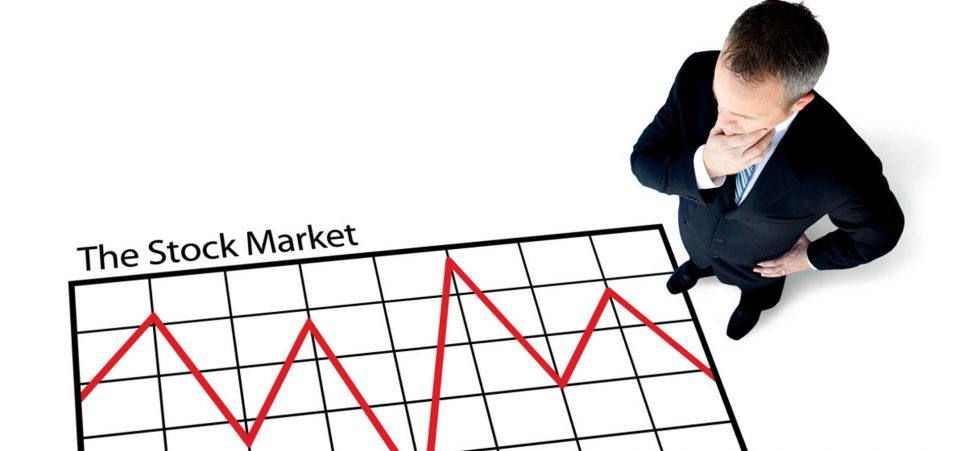
Nothing to see here. Another day, another record high for the Dow Jones Industrial Average (DJIA) and S&P 500. Since the U.S. election in November 2016, investors have been in a perpetual state of bliss, afraid to miss out on the stock market rally.
The honeymoon is being propped up by the belief that President Donald Trump’s proposed tax cuts and deregulation will be good for corporate America. This has pushed the markets into uncharted, overvalued territory, with warning signs pointing to a stock market crash.
A stock market crash is inevitable. It’s the way the markets cycle: boom, crash, echo.
The difficulty, of course, is seeing the warning signs. Or rather, being able to pay attention to them when the air is full of annoying static.
Right now, the markets are going crazy and Wall Street is celebrating, pretty much in the same way it did back in 1929, 2000, and 2008. “This time though. It’s different, so there’s no need to fear a crash.” Again, a similar sentiment was championed back in…well, 1929, 2000, and 2008.
Almost everyone is in agreement that stocks are significantly overvalued. What they aren’t in agreement with is how much longer the bull market will keep charging ahead. Or if the second-longest bull market in history will end with a whimper or a bang. The latter seems much more plausible than the former.
Bullish Indicator a Little Too Bullish
Since the U.S. election, the S&P 500 has advanced almost 11% and the Dow Jones Industrial Average is up almost 13.5%. Those would be excellent returns for a 12-month period, let alone a three-month one.
Right now, the S&P 500 is 8.5% above the 200-day moving average and the DJIA is 11% above its 200-day moving average. Being 10% above is a warning sign. The S&P 500 is closing in on that dubious bullish indicator. For the Dow Jones, that warning sign is in the rear-view mirror.
The surge in stock prices, again, due more to Trump’s anticipated tax reforms than stellar first-quarter earnings, has elevated stock valuations to unsustainable levels. The cyclically adjusted price-to-earnings (CAPE) ratio shows that the S&P 500 is overvalued by 83%. The ratio is currently at 29.27; the long-term average is 16. (Source: “Online Data Robert Shiller,” Yale University Department of Economics, last accessed February 21, 2017.)
The CAPE ratio has only been higher for longer twice, in 1929 and 1999. Pretty soon, we’ll only be able to say it has been higher once! Before Black Tuesday in 1929, it was at 30. In 1999, the ratio was at 45.
Will History Repeat for President Trump?
Even President Trump, who, in the run-up to the election said stocks were in a “big, fat, ugly bubble” has changed his tune and has recently Tweeted, “Stock market hits new high with longest winning streak in decades. Great level of confidence and optimism – even before tax plan rollout!” (Source: “Twitter post,” Donald J. Trump Twitter account, February 16, 2017, 7:34 a.m.)
It’s been noted that the Dow Jones Industrial Average’s post-election Trump bump is following a trajectory similar to that following Ronald Reagan’s election in November 1980. In the six-month period following Reagan’s election win in November 1980, the DJIA gained approximately 15%.
It has only been three months since President Trump won the election, and the Dow Jones is already up 13.5%.
If history follows political lines—and all things being equal (which they never are)—thanks to the hype surrounding President Trump, his stock market honeymoon period could last another month or two. This would send valuations even unsustainably higher as we near the typically slower summer trading period.
Stocks didn’t fare very well after Ronald Reagan carried investors over the threshold. After Reagan’s honeymoon period ended, the DJIA trended lower and ended 1981 down 15%.
Will investors face the same challenges under Trump? Chances are that the stock market correction or crash will be much more severe. In the early days of Reagan’s presidency, the U.S. was hit by a sustained recession that lasted from July 1981 to November 1982.
In the spring of 1981, just a few short months before the recession began, most Americans were, as they are today, optimistic about their economic futures. Almost half (48%) believed that their financial positions would be better in the next 12 months. Only 15% thought it would get worse. And 49% said they believed that Ronald Reagan’s economic policies would put more money in their pockets. (Source: “Reagan’s Recession,” Pew Research Center, December 14, 2010.)
Sound familiar?
After Donald Trump’s political honeymoon is over, it’s anyone’s guess as to how investors will respond. Investors and consumers are increasingly optimistic, and Trump plans on revealing the most ambitious, “phenomenal” tax plan since the Reagan era in the coming weeks.
If it doesn’t live up to the hype or takes too long to trickle down and help out the average American, you can expect confidence levels on Wall Street and Main Street to wane, fast.


