One Technical Indicator Says Silver Prices Could Be Presenting a Great Opportunity
Don’t ignore silver prices; the gray precious metal could be presenting a great opportunity.
Understand that silver remains undervalued relative to other assets.
For example, look at the stock market; valuations have skyrocketed over the past few years. Investors are paying top dollar for stocks.
Even look at metals like copper. The price of copper has increased more than 50% since bottoming in 2012. Aluminum, zinc, and other similar metals have seen massive moves to the upside as well.
But silver prices remain 66% below their peaks in 2011. So why remain bullish on silver?
You see, silver prices may be down right now, but they are not out.
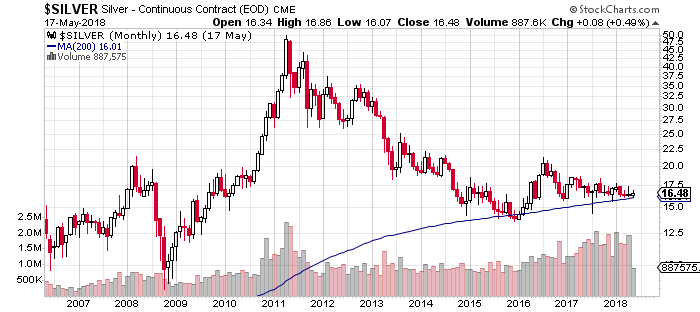
Look at the chart below.

Chart courtesy of StockCharts.com
Pay close attention to the blue line on this chart. It’s the 200-month moving average of silver prices.
Notice something interesting?
Since 2016, we have seen this moving average get tested at least four times. Every time silver prices touched their 200-month moving average, they bounced higher. In mid-2017, we saw the gray precious metal drop below this moving average, but it recovered very quickly.
What does this mean?
At its core, the 200-month moving average is used as a long-term trend indicator. Silver prices remaining above this average says that the long-term trend remains intact. With this, don’t forget the most basic rule of technical analysis: the trend is your friend until it’s broken.
Also, with silver prices bouncing off the 200-month moving average, it tells investors that they could use it as a buying point.
Also know one more thing: as silver prices have found a lot of support at the 200-month moving average, we have seen a massive increase in volume relative to what we saw between 2012 and 2015.
This says that there are a lot of buyers at the current level.
Gold-to-Silver Ratio Chart Says Silver Could Soar 73%
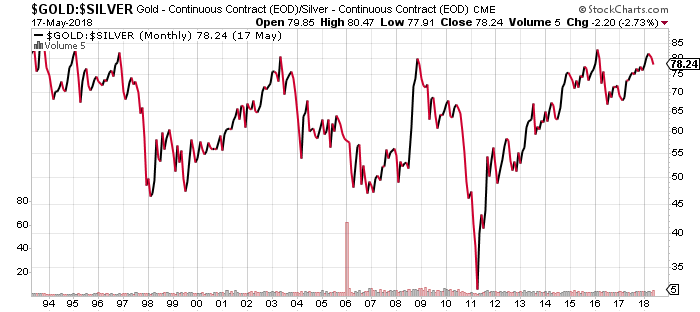
Look at another chart below.

Chart courtesy of StockCharts.com
The chart above shows the gold-to-silver ratio. It tells us how many ounces of silver it takes to buy one ounce of gold.
Over the past 25 years, this ratio has been trading in a range of 80–45. Only in 2011 did it drop below that range.
Currently, the ratio stands at the top of the range. If we assume that this ratio goes to the 45 area and that gold prices remain at $1,290, silver would have to increase to roughly $28.66. That’s 73% higher than where silver prices currently stand.
Dear reader, the two things mentioned here are only a few of the reasons why I remain bullish on silver prices.
If you pay attention to the demand and supply in the silver market, there are a lot of problems—all in favor of those who are bullish.
We also see an emergence of new buyers in the silver market, particularly in India. It will be interesting to see how the country that already has an appetite for gold now treats silver.
To give some perspective, in April, almost $481.7 million worth of silver was imported to the country. This was 36.5% higher than the same period a year ago. (Source: “Quick Estimates For Selected Major Commodities For April 2018,” India Ministry of Commerce and Industry, last accessed May 18, 2018.)
In April 2018, India imported almost $2.6 billion worth of gold—33.1% lower than in April 2017.
As I see it, silver prices are trading at rock-bottom levels. The longer the precious metal remains at its current low price, the bigger the upside there could be later.


