These 3 Charts Say Silver Prices Could Skyrocket
Silver prices could be on the cusp of showing massive returns. Don’t buy into the negativity that hovers around the gray precious metal these days. Investors need to pay attention to three charts. They are screaming “silver could be the next big trade.”
S&P 500 And Silver Correlation Calls for Possible 1,300% Increase
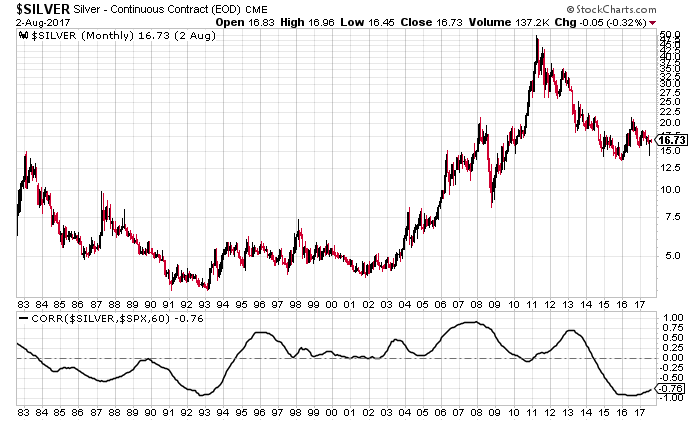
First, look at the correlation between the S&P 500 and silver prices. It’s very powerful, to say the least.
In the chart below, you will notice that, whenever the correlation between the S&P 500 and the precious metal hits almost negative, there’s a strong bottom in place.
Chart courtesy of StockCharts.com
The last time we saw something like what we are seeing now was between 1991 and 1993. In the midst of it all, we saw a bottom made. After this, we saw a bull run begin and silver prices reach close to $50.00. That was an increase of roughly 1,300%.
If we see this sort of move happen again, silver prices could reach beyond $200.00 an ounce.
Gold-to-Silver Ratio Suggests 66% Rise Possible
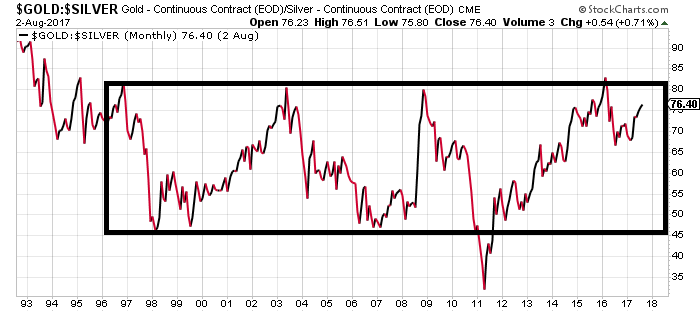
The second thing that investors need to pay attention to is the gold-to-silver ratio. At its core, this ratio essentially says how many ounces of silver it takes to buy one ounce of gold. Usually, this ratio is used to examine silver’s value. If the ratio is too low, prices may be too high. If the ratio is high, silver prices are considered to be cheap.
Please look at the chart below, and pay close attention to the highlighted area.
Chart courtesy of StockCharts.com
Over the last 20 years, there has been a pattern on the gold-to-silver ratio chart. When the ratio reaches the 80 area, it drops and goes to as low as 45. Not too long ago, this ratio hit slightly above 80 and has since declined. This is bullish for silver prices.
If we assume that this ratio hits 45, and gold prices remain around the $1,250 level, silver prices could reach $27.77. This would mean an increase of 66% from where it currently stands.
Mexican Peso And Silver Correlation Telling Something Powerful
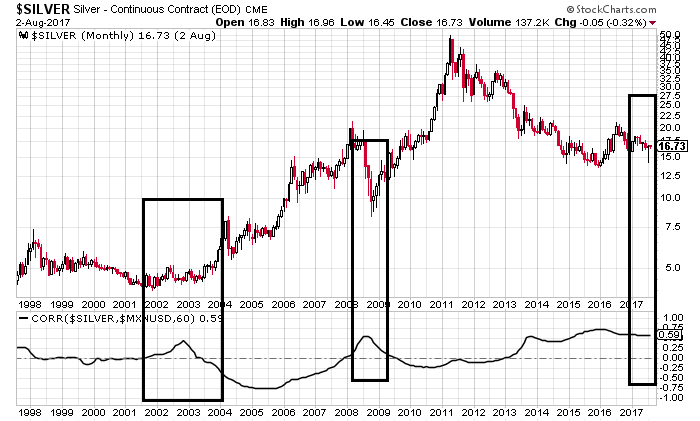
Lastly, pay attention to the correlation between silver prices and the Mexican peso. Why the peso and silver? Mexico is the biggest silver-producing country, and the correlation between the currency and silver shows something very powerful.
Please see the chart below.
Chart courtesy of StockCharts.com
Whenever the correlation between silver prices and the Mexican peso hits above 0.6, we see a bottom forming. This happened in 2002 and 2008. After both of these times, silver had a solid run to the upside.
The correlation between silver and the Mexican peso stands at that level again. Are we seeing a bottom in the making?
Know this: the last two times that the precious metal formed a bottom, silver prices increased by several times in the following few years.
Silver Prices Outlook: All Bases Loaded, $50.00 Possible?
Dear reader, the charts above make me more bullish on silver than ever before. My forecast for a while has been $50.00 silver. I still stick to it, and I believe it could happen sooner than later.
When will silver prices start to move higher? This is very difficult to predict, and if anyone claims to be able to tell you the exact time, be very careful. Here’s what I see: the longer that the gray precious metal remains low, the bigger and the more violent the upside could be.

