Is This the Slowest Economic Recovery Ever?
The anemic economic recovery in 2017 is simply a continuation of the so-called economic recovery that started under the Barack Obama administration. While the economic recovery might be in its eighth year, despite the longevity, it has been the slowest economic recovery since World War II (WWII). This, in conjunction with the slow global economic recovery, puts President Donald Trump’s pledge to get abysmal U.S. annual gross domestic product (GDP) growth to four percent in serious jeopardy.
Trump has been lambasted for making up statistics. And some of those accusations certainly deserve to stick. But one fact that Trump was most definitely correct on was his assertion that Americans are living through the worst economic recovery in modern times.
On the campaign trail, Trump blamed outgoing President Obama for the terrible state of the U.S. economy and recovery. Trump said, if he was elected, his pro-growth strategies—including cutting red tape, slashing taxes, and increasing spending—would help jolt the sluggish U.S. economy to 3.5% to four percent annual GDP growth.
Can President Trump actually achieve this lofty goal? Keep in mind that Trump inherited the worst economic recovery in the post-WWII era. The national debt is approaching $20.0 trillion, and the national deficit is near $600.0 billion. Moreover, GDP growth is garbage. It will be tough to get GDP to run wild, but it will also be difficult for Trump to actually do worse than Obama.
Sluggish U.S. GDP Could Stall Economy
The economic recovery is in its eighth year but, in terms of average GDP growth, we’re knee-deep in the slowest expansion on record. President Trump wants to get U.S. annual GDP up to four percent, but in this economic climate, it’s going to be almost impossible.
The most recent recession began in December 2007 and ended in June 2009, three months after the stock markets bottomed. The recession lasted 18 months and was the longest economic contraction since WWII. During this short time frame, U.S. real GDP fell four percent.
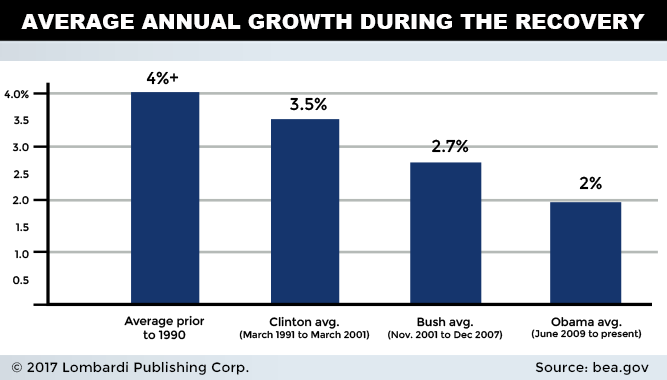
Enter President Obama. During Obama’s illustrious eight-year reign, the U.S. economy grew, on average, just two percent. In the 10 previous expansions, real GDP grew, on average, 4.3%.
Obama is also the only president to have never had one year of three-percent GDP growth. Even under George W. Bush, average GDP growth was 2.7%. Under President Bill Clinton, average annual GDP growth during the recovery was 3.5%. Unlike Obama, Bush and Clinton couldn’t take advantage of quantitative easing and artificially low interest rates to boost the economy. Not that Obama was able to do anything with it, either.
2016 GDP Was One of the Worst in 25 Years
What did the U.S. economy look like when Obama left office? In 2016, U.S. GDP was a grandiose 1.6%; the worst reading since 2011. In 2015, U.S. GDP was a decent 2.6%. If we’re in an economic recovery, we tend to want to see GDP growth increase in a consistent manner. (Source: “National Income and Product Accounts Gross Domestic Product: Fourth Quarter and Annual 2016 (Third Estimate),”Bureau of Economic Analysis, March 30, 2017.)
This wasn’t a one-off bad year; it was the fourth-worst year since 1992 and continues a trend of reliable inconsistency.
| Year | GDP Growth Rate |
| 2008 | -0.3% |
| 2009 | -2.8% |
| 2010 | 2.5% |
| 2011 | 1.6% |
| 2012 | 2.2% |
| 2013 | 1.7% |
| 2014 | 2.4% |
| 2015 | 2.6% |
| 2016 | 1.6% |
(Source: Ibid.)
Despite the Federal Reserve’s trillion-dollar easy U.S. monetary policy, Obama could not get banks to lend and consumers to spend the country to economic prosperity. Despite all the Herculean efforts, the U.S. economy remains fragile. Even the Fed’s U.S. GDP growth forecast for 2017 and 2018 of 2.1% doesn’t exactly show an economic recovery in bloom.
This continues to suggest that the U.S. economy is going to trudge along at subpar growth. And it appears that the strongest economy in the world is going to have to contend itself with ultra-slow growth rates.
Despite Longevity, Economic Expansion is Glacial
On one hand, GDP is terrible; on the other, the expansion is now in its eight year. This has led many to suggest that slow, long-term growth is better than a recession. Which is obviously true. But this is a small consolation to the biggest economy in the world, and is a little bit of a desperate stretch to make the previous administration look competent.
To recap, in terms of average growth, the current economic expansion has been the weakest since 1949, advancing just 2.1% since 2009. (Source: “Economic Growth Slower Than Previous 10 Expansions,”Congressional Research Service, June 30, 2016.)
Still, slow and steady does produce numbers. The U.S. economy is more than 15% larger than it was when the recession ended in 2009. But again, this data is cooked, and that’s saying a lot. The recovery under Obama is not just slower and weaker than prior recoveries; it was manufactured by the Fed’s quantitative easing and artificially low interest rates.
Under President Richard Nixon, the U.S. economy expanded 16% over three years. Under Bill Clinton (2001 to 2007), the economy advanced 18%. In the 1960s (1961–1969), the economy grew 52%.
The average economic expansion since 1949 has lasted a little more than five years. The longest expansion on record, during the 1990s, made it to 10 years. The current economic recovery occurred entirely under Obama’s tenure, and is now Trump’s responsibility. For the Obama recovery to break a modern-day record, it will need to continue past the halfway mark of Trump’s first term.
But surely the economic data rolling in suggests that the U.S. recovery shows growth, not an economic slowdown? For starters, the economic recovery under President Obama has fallen well short of the average recovery and ranks, overall, as the worst since the Great Depression.
Had Obama’s recovery tossed up the same kind of averages of the 11 recoveries since the Great Depression, there would be six million more jobs, American incomes would be $17,000 higher, and six million fewer Americans would be living in poverty. (Source: “Why The United States Has Suffered The Worst Economic Recovery Since the Great Depression,” The Heartland Institute, August 1, 2016.)
On top of that, during Obama’s first term, real median income fell by approximately eight percent; that’s the equivalent of losing one month’s pay per year. Income for the bottom 20% of American households fell by a similar amount. The only income growth has come from those in the top 20%.
So what about all the jobs that Obama created? Over 14 million jobs were created since the depths of the financial crisis. In fact, under Obama, the U.S. experienced the longest string of consecutive monthly job gains in economic history.
Sadly, most of those jobs were low-paying part-time jobs with little-to-no security. The demand for waiters and waitresses has been strong since the recovery began, while the demand for manufacturing jobs has tanked.
Wage growth has been anemic, household debt levels will soon be at pre-recessionary levels, half of Americans would have to borrow money to cover a $400 emergency expense, and nearly half of all Americans have no retirement savings. The U.S. unemployment rate in 2017 may be 4.7%, but the underemployment rate is near 9.5%.
U.S. Poverty Soars During Economic Recovery
President Obama was viewed as a visionary by many, but his failed economic policies helped kill the middle class and sent many Americans kicking and screaming into poverty. What Obama taught us about the current economic recovery is that you can’t buy your way out of it.
How much did poverty soar during President Obama’s stay in the White House? Six million more Americans are in poverty than when Obama entered the Oval Office.
The poverty rate is actually close to 15% higher than when the “War on Poverty” was launched in 1966. According to the most recent data, the U.S. poverty rate is 13.5%; that means an estimated 43.1 million Americans are living in poverty. And the majority of poor Americans are in their prime working years.
While poverty is evenly distributed, it is still heaviest in the south and in states that vote Republican.
In 2009, the year that Obama took office, the U.S. poverty rate was 14.3%. Fast forward to 2015, the last year for which data is available, and the overall poverty rate dipped slightly to 13.5%, but the poverty rate in the poorest states was, for the most part, higher.
|
Top 10 States in Poverty in 2009 (National Average 14.3%) |
Top 10 States in Poverty 2015
(National Average 13.5%) |
| Mississippi – 21.9% | New Mexico – 19.7% |
| Arkansas – 18.8% | Kentucky – 19.5% |
| Kentucky – 18.6% | Mississippi – 19.1% |
| District of Columbia – 18.4% | Louisiana – 18.6% |
| New Mexico – 18.0% | Georgia – 18.1% |
(Source: “Poverty: 2008 and 2009” and “Historical Poverty Tables: People and Families – 1959 to 2015,” United States Census Bureau,, last accessed April 6, 2017.)
Not surprisingly, the number of people using food stamps remains high, despite the so-called economic recovery. In 2007, just before the recession, 26.3 million Americans received food stamps. By 2009, the number had ballooned 27.3% to 33.49 million and, by 2014, it had soared 81% to 47.6 million, or 15% of all Americans. (Source: “Supplemental Nutrition Assistance Program Participation and Costs,” United States Department of Agriculture , last accessed April 6, 2017.)
In 2016, the number of Americans using food stamps declined to 44.2 million, but that number is still 68% higher than it was before the so-called economic recovery.
Wall Street might be enjoying the slow and steady economic recovery, but most Americans are not even aware there is an economic recovery going on. This is going to hit the U.S. even harder when the long-in-the-tooth—and very selective—economic contraction begins.
U.S. Economic Outlook for 2017
We are most certainly in the midst of the slowest economic recovery in modern history. And the U.S. economic outlook for 2017 remains bleak. This despite the Federal Reserve raising its key lending rate in December 2015, December 2016, and March 2016. The Fed might think the U.S. economy needs three or four rate hikes in 2017 in regards to economic growth, but the data and most Americans would suggest otherwise.
How can we champion an economic recovery when GDP is 1.6% and well-paying, secure jobs are scarce? Debt levels are way up, savings are down, and retirement funds are depleted. Moreover, corporate and personal bankruptcies are up and more and more businesses are laying off people.
If the U.S. economic recovery even exists, why are major retailers like Sears Holdings Corp (NASDAQ:SHLD), Macy’s Inc (NYSE:M), and J C Penney Company Inc (NYSE:JCP) doing so poorly? Heck, even Ralph Lauren Corp (NYSE:RL) can’t keep it together. The slowest economic recovery in modern history will continue because of job uncertainty, stagnant wages, and budgets that have been stretched to the limit.
President Trump inherited an economic mess. The slowest, most pathetic economic recovery will continue, invisible to most Americans. It’s just a matter of time as to whether the average American will even notice when the economic recovery ends and the Great Contraction begins.


