Are Institutional Investors Anticipating Stock Market Crash?
Mark these words, stock investors: Be very careful. A stock market crash could be looming and this time around, the losses could run rampant.
People often say to “follow the money.” By this, they mean to look at where institutional investors are going. Institutional investors have a lot of buying power and can move the markets. Going back to the stock market crash of 2008-2009, it was the hedge funds and mutual funds selling stocks that escalated the sell-off.
As it stands, we’re seeing institutional investors rushing out of stocks. It seems like they are in a hurry. It has to be questioned if they are anticipating some sort of sell-off.
For example, consider the National Association of Active Investment Managers (NAAIM) Exposure Index. This index shows what percentage of active managers’ portfolios consists of stocks.
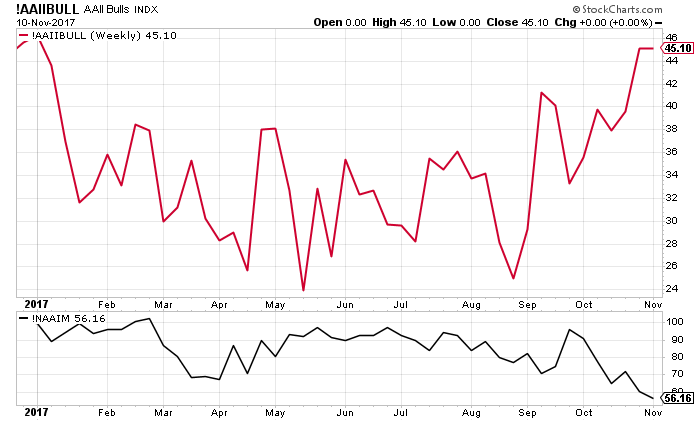
Over the past few months, active investment managers have been reducing their exposure to stocks very quickly. Near the end of September, their portfolios consisted almost entirely of stocks. Now, their portfolios are 56% stocks. This is the lowest level of stock exposure since mid-2016.
With this said, look at the chart below.
Chart courtesy of StockCharts.com
In the chart above, the results of the American Association of Individual Investors (AAII) Sentiment Survey are plotted at the top. The NAAIM Exposure Index is plotted at the bottom.
As it stands, the AAII Sentiment Survey, a measure of what individual investors are thinking about stocks, suggests that over 45% of investors are bullish on the stock market. In late August, this figure was just close to 25%. So the number of bullish individual investors has almost doubled in a matter of months.
See the disparity?
There’s an interesting phenomenon taking place and it suggests that individual investors are getting bullish, while institutional investors seem to be running away from stocks.
The last time something like this was happening and was very evident was back in 2007. This is when the U.S. markets made major tops. Are we seeing a repeat of that? Obviously, with time, we will know more.
Where’s the Stock Market Headed Next?
Dear reader, it’s important not to jump to conclusions and predict tops or bottoms. To be clear, the chart presented here doesn’t mean I am predicting a top. To me, this chart is very interesting to watch.
Looking at the overall stock markets, I continue to ask one question that investors are ignoring: Could the markets provide the same returns in the next five years as they have in the last five years? I see it to be very difficult. I will not be shocked if there’s a stock market crash before there’s a massive rally to the upside.
There one more thing investors need to look out for….
You see, as key stock indices are soaring, we see the amount of money borrowed to buy stocks—margin debt—also increase. Consider that in September, the margin debt on the New York Stock Exchange (NYSE) reached close to $560.0 billion. This is the highest on record. (Source: “Securities market credit ($ in mils.), 2017,” NYSEData, last accessed November 13, 2017.)
If there’s a stock market crash, margin debt could cause the sell-off to escalate.


