Charts Painting a Bearish Outlook for the Stock Market
We could be setting up to go much lower on the stock market. If you hold a lot of stocks in your portfolio, it may be time to pause and reflect.
A massive sell-off could be ahead. A bear market could be possible.
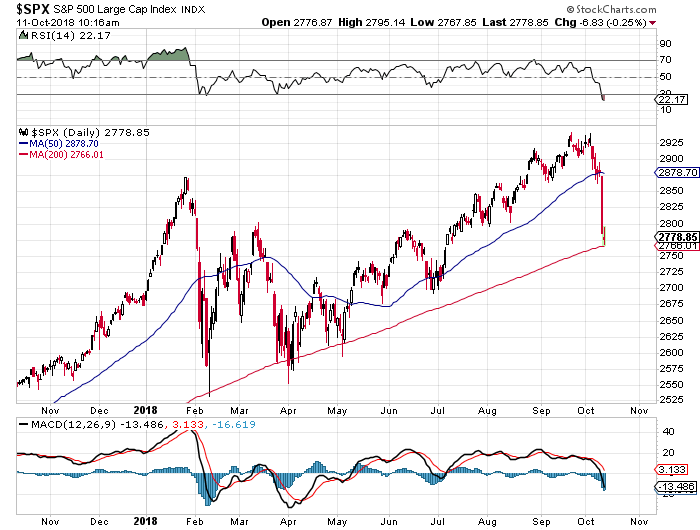
To see where the stock market could be headed for the short term, look at the chart below of the S&P 500.
Over the past few months, investors thought that what happened in early 2018 was just a minor glitch on the stock market and that key stock indices could continue to move higher.
For a bit, investor optimism drove stocks higher.
But now, we see bearish sentiment prevailing.
As it stands, the S&P 500 is trading below its 50-day moving average. This says the short-term trend is now pointing downward.
The index is also fast approaching its 200-day moving average. If the index breaks below it, then the long-term trend would also be pointing lower.
With this in mind, remember that the trend is your friend until it’s broken.

Chart courtesy of StockCharts.com
When you look at the momentum indicators like the moving average convergence/divergence (MACD) at the bottom of the chart, and the relative strength indicator (RSI) at the top of the chart, it looks like S&P 500 had a sudden shift.
All of a sudden, sellers are controlling the market. They are selling and could take the index much lower.
How low could the S&P 500 go?
Know that when there’s a sell-off, stock markets tend to test the nearest strong support level. For the S&P 500, the nearest strong support level isn’t until the April lows, around 2,575—that’s roughly 7.5% from where it currently stands.
This move would put the S&P 500 in correction territory, which is when the market drops over 10% from its recent highs.
Profit-Taking Could Be on the Table, And It Could Make Sell-Off Bigger
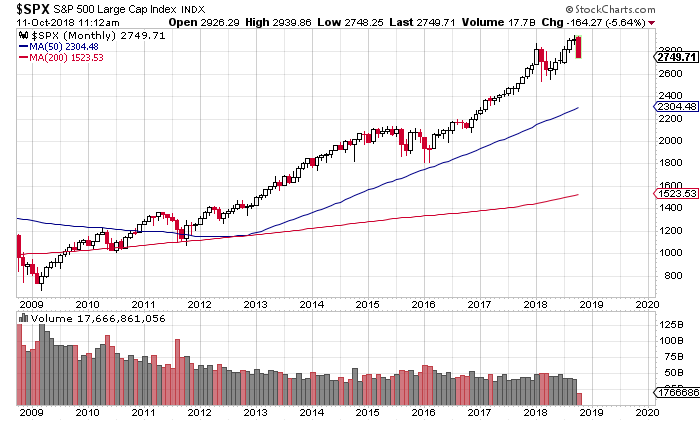
Now, look at the long-term chart of the S&P 500 below…
You see, the sell-off we see now doesn’t look like that big of a deal. Stock markets have surged since 2009. The S&P 500 has skyrocketed over 300% since its 2009 lows.
But this is where investors must ask one question: Could we see some sort of profit-taking event take place?
Take a look at the chart below. The volume of the S&P 500 is plotted at the bottom.

Chart courtesy of StockCharts.com
Notice something interesting?
As the stock market moved higher, volume declined.
What does it mean? This says that a lot of investors just bought and held onto their stocks. They didn’t trade much.
As said I earlier, one really has to ask what happens if those investors who have held on this entire time get nervous. What if they look to take some profits off the table?
Dear reader, as I see it, the current sell-off could definitely take a toll on investor sentiment, especially for those who bought in late 2016. They aren’t used to volatility in the stock market.
If they panic, we could see a big sell-off on the markets.
For the S&P 500, in the long term, there isn’t really much support until the 2016 highs around 2,150—about 22% below the current price. This would put the S&P 500 in a bear market.
I can’t stress this enough: It’s important that investors pay attention to capital preservation. In case there’s a sell-off, losses could mount very quickly.


