An Inverted Yield Curve Has Been a Traditionally Effective Predictor of U.S. Recession
Is a recession coming? A flattening yield curve seems to suggest it might. This has been a very reliable predictor of the future vitality of the economy. But should it become inverted, that’s a whole new ballgame. Unfortunately, we may be witnessing signs of this happening. If the Federal Reserve’s rate hike schedule doesn’t veer off course, some predict an inverted yield curve signaling a possible recession. A U.S. recession would surely have devastating effects on stock markets, which are overvalued based on any reasonable metric.
So for non-bond aficionados, what exactly is a yield curve and what does it signify? A yield curve is a line that plots a series of interest rates maturing at different dates (from one month out to 30 years). An inverted yield curve is simply when interest rates on long-duration bonds are lower than interest rates on short-duration bonds. Under normal circumstances, long-duration bonds carry higher rates to account for the extra risk of holding the bonds for longer periods of time.
When the yield curve inverts, it means something is wrong with the economy. It means long-term growth plus inflation expectations are lower than present. But more importantly, banks have less incentive to lend out money to finance things like capital expenditures and mortgages when short-term rates are higher. Put another way, why would banks take on duration risk while earning fewer returns lending money on the long end? When the curve inverts, it also incentivizes banks to firm up long-term loan and credit standards. When that happens, loan growth slows down. And we all know at this point that once the driver of growth stalls, the economy will take a disproportionate hit.
By contrast, a flat yield curve carries little difference between rates of short- and long-dated bonds. It signifies that future growth expectations will be weak. This most commonly occurs as a sloped yield curve transitions to an inverted yield curve and vice versa. It’s usually transitory between expected strong- and weak-growth extremes. If the yield curve does flatten this time around, it may signal an inversion a short time later.
Whether the yield curve flattens or fully inverts matters. It can provide a rough estimation of how deep the future contraction will be, which has implications on how much the market will drop. A flat curve may signify a market “correction” only. An inverted curve may imply something far greater, considering how expensive the market is right now. Just imagine how expensive it will look if S&P earnings decline 50% or more. In 2008, earnings per share (EPS) fell over 90% peak-to-trough. It can happen.
Key Predictor of the Health of U.S. Economy Is Inching Closer to Signaling a Possible U.S. Recession in 2017
The inverted yield curve history of predictive success is impressive. It’s predicted the last seven recessions going back to 1969 without fail. The rule of thumb is that once the curve inverts, recession follows in about a year. This happened in 2006, and again in 1998. Recession came knocking about a year later, like clockwork.
Despite their prognosticating prowess, bond yield signals are often underappreciated during late bull market phases. The euphoric undertones of market participants are an effective blinder. Wall Street wants to believe the bull cycle will keep running—it makes for better business. Investors can do without the death-defying moves lower, which can wipe out two years’ worth of gains in two weeks. Although it’s said the stock market looks ahead six-12 months, with the decline in fundamentals and value investing, financial news cycles (and reactions to them) are getting shorter.
Nonetheless, the U.S. bond market is not so easily fooled. It genuinely takes a long-term view of economic prospects and is not subject to “valuation mania” associated with stock markets. It’s also much bigger, valued at $39.5 trillion outstanding by mid-2015, or about 1.5-times the size of U.S. stock markets. (Source: “The New Bond Market: Bigger, Riskier and More Fragile Than Ever,” The Wall Street Journal, October 5, 2015.)
With the U.S. economic outlook in tatters right now, the bond market seems to be sensing blood. Although it’s not a foregone conclusion an inverted yield curve will happen, signs are foreboding.
For one, the “Trump trade” appears to be unwinding. You know, the one where invigorated economic optimism caused the 10-year bond yields to explode from 2.12% to 2.62% in just over a month, and sent U.S. stock indices surging to double-digit percentage increases in a few weeks. Now the bond market is signaling that all this optimism was a false alarm. The yield curve is now flatter today than on election day. This means that far from “reflation” taking place, the market is predicting the exact opposite. In other words, the bond market is throwing in the towel; it doesn’t think that Trump’s growth initiatives, tax cuts, earnings repatriation etc. will actually take place.
For now, the stock market is ignoring these signals, but for how long?
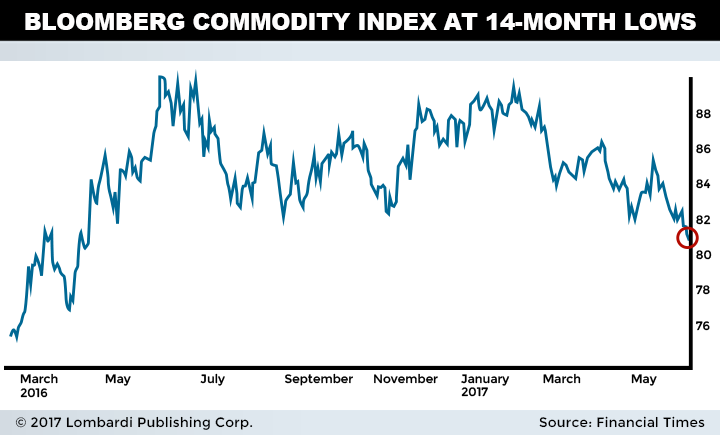
Another major market firmly confirming a weaker U.S. economy are commodity prices. They have been moved in lock-step with lower 10-year bond prices in recent weeks. Crude oil has sunk about 18% from post-election 2016 highs. Copper is down eight percent in that same period. The all-encompassing Bloomberg Commodity Index (BCOM)—comprised of agriculture, base metals, energy, precious metals, and specialty foods—has now reached a 14-month low.
It seems unlikely that both a flattening yield curve combined and softer commodity prices would yield a false signal of economic weakness. If the economy were truly on the cusp of strong growth, commodity prices would be trending higher. Especially stables like energy, where consumption should be increasing along with manufacturing output. But a crude oil glut rules the day, despite various attempts by OPEC of limiting supply. The situation is more complicated than that, but the key fact still remains that end U.S. hydrocarbon demand is just not materializing in a manner consistent with accelerating growth.
Will The Yield Curve Invert?
This largely depends on whether the Federal Reserve keeps raising interest rates, like it has implied. The fact that it has raised rates three times in the last month amidst lackluster growth and inflation numbers is telling. Some economists (including ourselves) believe the Fed may be tightening too late, thus playing catch-up. If that’s true, chances are that more rate cuts are coming unless there’s some sort of market shock. Continued muddle-through should mean higher rates, which equates to a higher probability of an inverted yield curve.
The Fed might also be giving itself some breathing room for the next recession. Why? Because the current Fed Funds rate is just 1.25%. There’s little room to stimulate loan growth if required. This is the quandary that the Fed has created. If indeed its models are wrong and it’s started tightening too late, it’s actively contributing to the economic slowdown it’s trying to thwart.
However, if the Fed puts on the brakes and stops cutting, it’ll be powerless to act when the next recession comes. Cutting rates from 1.5% to zero percent isn’t going to do much to stimulate new demand. Not amidst the biggest credit expansion the nation has ever seen, and against the backdrop of record high debt (both consumer and national), a likely tanking stocks market, and high U.S. housing prices. The Fed’s balance sheet rests at $4.5 trillion, which is $3.7 trillion higher than at the start of the Great Recession. The barriers to additional stimulative policy measures are much greater now. There’s no guarantee the Federal Reserve can halt economic deterioration this time around.
In fact, research indicates that the Fed must cut at least 300 basis points (three percent) for the economy to experience any relief from a recession. Perhaps this is why the Fed is raising rates even when though signs of economic growth are waning. And a continuing series of rate hikes favors the likelihood of an inverted yield curve. (Source: “Odds Rising For Recession, Falling Stocks And Inverting Yields,” Seeking Alpha, June 15, 2017.)
Is another recession looming? If the declining interest rate spread is to be believed, then yes. At best, America will test the bounds of zero-percent growth, and in many ways, this will have the same effect. The market wouldn’t crater as much, but the carnage will be bad. Again, it’s simply about stock market valuations trading much too richly, and needing readjustment as deflationary forces take hold.
But if the yield curve does invert, watch out. As I’ve mentioned, not only do record high equity prices and crashing earnings mix like a cat thrown into a swimming pool, the Fed is responding from a much lower starting point than at any time in history. It has an impaired balance sheet that it’s actively trying to repair via selling fixed amount of bonds per month. To reverse course and become treasury buyers again would be an admission of its own monetary policy failures. The Fed does not want this.
In light of the current evidence, an inverted yield curve scenario seems likely. Our stock market crash predictions reflect our belief that the bond curve will eventually invert, signaling recession and a hard landing for the economy. Stimulative policy measures will be tried, but the Fed’s dealing with a pop gun now—there’s not enough room for rates to decline and not enough ability to expand the monetary supply.
That’s truly bad news when the only thing that matters is keeping credit and loan growth expanding.

